![<?echo $_SERVER['SERVER_NAME'];?>](/template/twentyseventeen/skin/images/header.jpg)
v \: * {behavior: url (# default # VML);} o \: * {behavior: url (# default # VML);} w \: * {behavior: url (# default # VML);} .shape {behavior: url (# default # VML);} st1 \: * {behavior: url (#ieooui)} / * Style Definitions * / table.MsoNormalTable {mso-style-name: ordinary table; mso-tstyle-rowband- size: 0; mso-tstyle-colband-size: 0; mso-style-noshow: yes; mso-style-parent: ""; mso-padding-alt: 0cm 5.4pt 0cm 5.4pt; mso-para-margin: 0cm; mso-para-margin-bottom: .0001pt; mso-pagination: widow-orphan; font-size: 10.0pt; font-family: "Times New Roman"; mso-ansi-language: # 0400; mso-fareast -language: # 0400; mso-bidi-language: # 0400;} table.MsoTableGrid {mso-style-name: grid type; mso-tstyle-rowband-size: 0; mso-tstyle-colband-size: 0; border: solid windowtext 1.0pt; mso-border-alt: solid windowtext .5pt; mso-padding-alt: 0cm 5.4pt 0cm 5.4pt; mso-border-insideh: .5pt solid windowtext; mso-border-insidev: .5pt solid windowtext; mso-para-margin: 0cm; mso-para-margin-bottom: .0001pt; text-align: justify; text-justify: inter-ideograph; mso-pagination: none; font-size: 10.0pt; font-family: "Times New Roman"; mso-ansi-language: # 0400; mso-fareast-language: # 0400; mso-bidi-language: # 0400;}
China Industrial Textile Industry Association Spunbond Nonwovens Branch  Guo Hexin
1 Â Overview of the development of nonwovens in the world
At present, the development of non-woven fabrics in the world is very fast, and it has become an emerging industry. Many countries and regions have established non-woven fabric factories. The most developed are Asia, North America and Europe, and the world ’s three largest nonwovens industry associations have been established, namely the China Industrial Textile Industry Association, the American Nonwovens Association (INDA) and the European Nonwovens Industry Association (INDEX) But so far there is no unified association in the world.
Global nonwovens assessment in 2008 (10,000 tons)
area
Europe
North America
Asia Pacific
China
other
total
Yield
142.8
146.4
149.7
200.22
69.7
709.22
% Of global
20.19
20.64
21.11
28.23
9.83
100
Source: American INDA (2009.5.29)
       335.9
Spunbond fabric is a global non-woven fabric -------- == 47.32%
              709.22
Evaluation of Spunbond Fabrics Worldwide (2008)
area
Europe
North America
China
Asia Pacific
other
total
Yield
73.2
60.7
84
74.4
43.6
335.9
% Of global
21.79
18.07
25.01
22.15
12.98
100
Source: American INDA (2009.5.29)
North American Nonwovens Production
years
2005
2008
growth rate
Yield
1.247 million tons
1.428 million tons
14.5%
Production of various nonwoven fabrics in North America
years
2005
2008
Variety
Production (10,000 tons)
Percentage (%)
Yield  (10,000 tons)
Percentage (%)
Polypropylene spunbond
34.916
28
41.412
29
acupuncture
22.446
18
25.704
18
Spunlace
14.964
12
18.564
13
Airlaid
12.47
10
14.28
10
Polyester spunbond
11.223
9
12.825
9
Chemical bonding
7.482
6
5.712
4
Meltblown
7.482
6
8.568
6
Wet method
7.482
6
8.568
6
other
6.235
5
7.14
5
total
124.7
100
142.8
100
Source: American INDA
2 Â Statistics of Nonwovens Production in Asia
The Asian nonwovens industry is mainly concentrated in China, Japan, South Korea, and Taiwan. In recent years, other Asian countries have also begun to produce nonwoven fabrics. The statistics of China, Japan, South Korea and Taiwan are as follows:
Statistical Table of Nonwovens Production in Four Asian Regions, 2001-2007 Â Â Â Â Â Â Â Â Â Â Â Â (Unit: tons)
2001
2002
2003
2004
2005
2006
2007
"07/06"%
Japan
298038
295883
296753
296913
313941
329752
338281
102.6
Korea
110440
195820
199298
203921
205960
210795
213065
101.1
Taiwan, China
107934
107739
135720
139141
140551
144000
160038
111.1
China
447000
600000
836000
1042000
1177000
1396000
1721000
123.2
total
993412
1199442
1467735
1681975
1837452
2080547
2432384
116.9
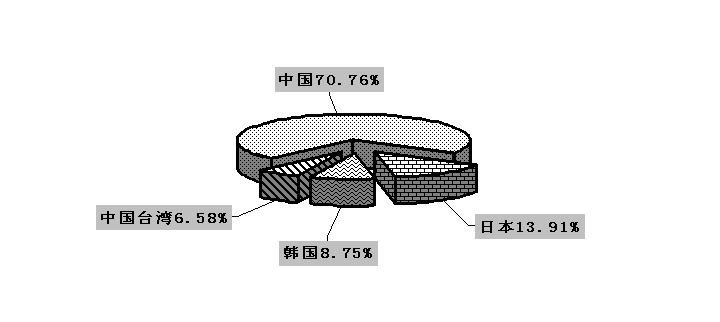 Proportion of Nonwovens Production in Four Asian Regions in 2007
It can be seen from the above statistics that China is the largest producer in Asia, accounting for 70.76% of the total output of nonwovens in the four Asian regions, 5 times that of Japan, 8 times that of South Korea and 10 times that of Taiwan.
           Production statistics of various nonwoven fabrics in four Asian regions in 2007        (Unit: tons)
China
Japan
Korea
Taiwan, China
total
China accounts for 4%
Chemical bonding
204000
29162
30537
7876
271566
75.1
Thermal bonding
165000
38085
26556
13894
243535
67.75
acupuncture
427000
94630
76653
50447
648730
65.82
Spunlace
118100
30015
7062
26042
181219
65.16
Spunbond meltblown
719500
93651
68333
23215
904699
79.52
Airlaid
68000
20868
3924
38572
131364
51.76
Wet method
20000
31869
——
——
51869
38.55
total
1721600
338281
213065
160038
2432984
70.70
As can be seen from the table above, all varieties produced in China, except for the wet method, account for more than 50% of the other varieties. Among them, the spun bond method is the most prominent, accounting for 79.52% of the output of the four regions, followed by the chemical bonding method accounting for 75.1% of the four places.
In 2007 , the output of China's spunbond meltblown nonwovens was 7.7 times that of Japan, 10.5 times that of South Korea, and 40 times that of Taiwan.
In 2007 , the output of China ’s chemically bonded nonwovens was 7 times that of Japan, 6.68 times that of South Korea, and 26 times that of Taiwan.
3 Â Overview of China's nonwovens industry development:
As early as 1958, the Chinese non-woven fabric industry began to use the carding method in Shanghai for some condition tests. A workshop-like production plant was established in Shanghai in 1965. In 1961, Beijing began to develop the spunbond non-woven fabric project, but due to the Cultural Revolution and the national industrial level at that time, the Chinese non-woven fabric industry could not develop at all.
The real development of China's nonwovens industry was after the reform and opening up in 1978. In the past thirty years, China's nonwovens industry has grown from an insignificant small country in the world to the world's most productive country. In 1980, the national non-woven fabric output was only 5,000 tons, and by 2008, China's output had exceeded 2 million tons, an increase of 400 times over 1980. The growth is shown in the following table:
Statistical table of the total output of non-woven fabrics over the years
years
1978
1982
1996
1997
1998
1999
2000
2001
2002
2003
2004
2005
2006
2007
2008
Production volume
0.3
1.5
20
25
29
32
38
47.7
60
83.6
104.2
117.7
139.6
172.1
200.22
% Increase from last year
25
16
10.3
18.7
25.5
25.8
39.3
24.6
12.9
18.6
23.2
16.2
Note: 1. Production in 1978 and 1982 are estimated values.
   2. After 1996 , after the establishment of the China Industrial Textile Industry Association, there are detailed statistics every year.
Production and share of various non-woven fabrics in 2008

 Â Â Â Â Â Â Â Â Â Â Â Â Â Â Â Â Â Â kind
                  kind
  Yield
project
Output of various non-woven fabrics
Spunbond
Meltblown
Spunlace
acupuncture
Chemistry  Bonding
Thermal bonding
Airlaid
Wet method
2007 (10,000 tons)
172.16
69.72
2.23
11.81
42.7
20.4
16.5
6.8
2.0
2008 (10,000 tons)
200.22
84.92
2.3
15.55
48.3
twenty two
17.5
7.5
2.15
Increase in 2008 compared to 2007
16.3
21.8
3.14
31.67
13.11
7.8
6.06
10.29
7.5
Proportion in non-woven fabric (%)
100
42.41
1.15
7.77
24.12
10.99
Teeth Polishing,Dental Polishing,Dental Polishing Machine,Dental Lab Polishing Machine
Henan Hanchen Medical Technology Co., LTD , https://www.tchanchen.com