![<?echo $_SERVER['SERVER_NAME'];?>](/template/twentyseventeen/skin/images/header.jpg)
Beijing Agricultural Information Technology Research Center
National Agricultural Information Technology Research Center
Soybean Research Institute of Nanjing Agricultural University / National Soybean Improvement Center
Soybeans are one of the most important food crops in the world, most commonly used to make soy products, extract soy oil, brew soy sauce and extract protein. In recent years, China's soybean imports have increased year by year, reflecting that China's soybeans still have a large potential for high production. Using hyperspectral techniques for crop growth monitoring and yield estimation provides an effective way to estimate, monitor, and monitor crop growth simply, quickly, efficiently, and without damage.
In order to explore the influence of unmanned aerial hyperspectral spatial scale on soybean yield prediction accuracy, Shandong Jiaxiang Shengfeng soybean was used as the research object, and the multi-rotor UAV was designed as the platform equipped with Cubert UHD185 (the detailed technical parameters are shown in Table 1). The hyperspectral sensor of the UAV remote sensing agricultural monitoring system, the spectrum is measured vertically downwards, and the hyperspectral data of the drones of soybean growth period are obtained.
Table 1 UHD185 technical parameters
index
parameter
Model
UHD185
Brand Brand
Cubert
Mass weight
470g
Origin Orgin
Germany
Imaging speed
5 hyperspectral image cubes per second
Spectral channel Number of channels
125
Sampling interval Spectral samping
4nm
Field of view
20°
Spectral coverage Wavelength range
450~950nm
Spectral resolution
8nm@532nm
Data Data
Panchromatic and hyperspectral images
Each hyperspectral image and the corresponding full-color image acquired simultaneously were merged by Cubert-Pilot software to obtain the fused hyperspectral image. Secondly, Agisoft PhotoScan software was used to complete the splicing of hyperspectral image by using the point cloud data of the full-color image. . Focusing on the geometric center of the cell, the spectral reflectance of the canopy is extracted from the spliced ​​hyperspectral image. As shown in Figure 1, the spectral reflectance of the canopy corresponding to 21 different spatial scales of each cell is obtained. It can be seen that the spectral reflectance of the canopy corresponding to different spatial sampling areas has no significant difference in the visible light band, but in the near The difference in the infrared region is more obvious to extract the spectral reflectance of the canopy.
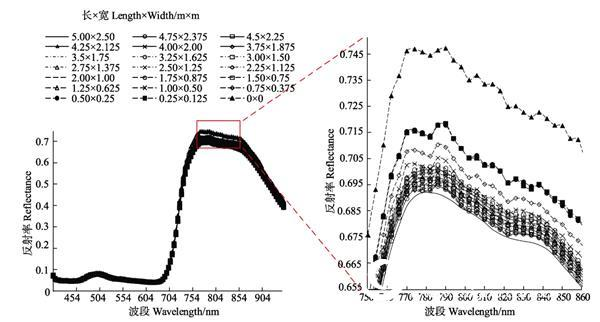
Figure 1 Canopy spectral reflectance corresponding to 21 different sampling areas
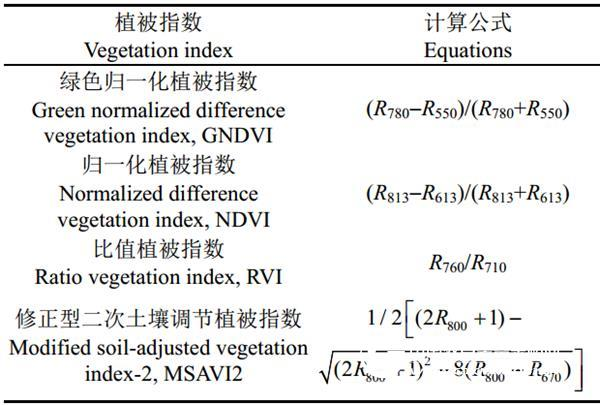
Based on the existing research results, this paper selects 4 planting index to establish soybean yield and UAV imaging hyperspectral remote sensing monitoring model. The vegetation index calculation method is shown in Table 2.
Table 2 Calculation formula of vegetation index
Based on the 21 sets of spatial scales, the canopy hyperspectral data and the measured yield were respectively established with the PLSR regression equation, and the prediction accuracy of the model at different spatial scales was compared to determine the optimal spatial scale. The curve of the correlation coefficient r of the PLSR model with the yield and the four vegetation indices as a function of the spatial scale area is shown in Fig. 2. The correlation coefficient r is between 0.795 and 0.812. The vegetation index of soybean canopy is significantly correlated with soybean yield. When the spatial sampling area is less than 8 m2, the modeling accuracy increases with the spatial sampling area. With the increase of sampling area, the modeling accuracy gradually becomes flat. When the spectral sampling area is larger than 10.13 m2, the modeling accuracy decreases with the increase of sampling area. When the spectral spatial scale is 4.25 m × 2.125 m and 4.5 m × 2.25 m, that is, 9.03 and 10.13 m2, the correlation coefficient r reaches the maximum value, and the maximum correlation coefficient is about 0.8117. It can be seen that when the UAV hyperspectral image-assisted soybean estimation study is conducted, the ratio of the spatial extent and width of the spectrum taken to the total length and width of the cell should be between 4.25:5 and 4.5:5, which can not only effectively reduce The influence of soil background noise and edge shadow spectrum around the plot can avoid the loss of soybean canopy information.
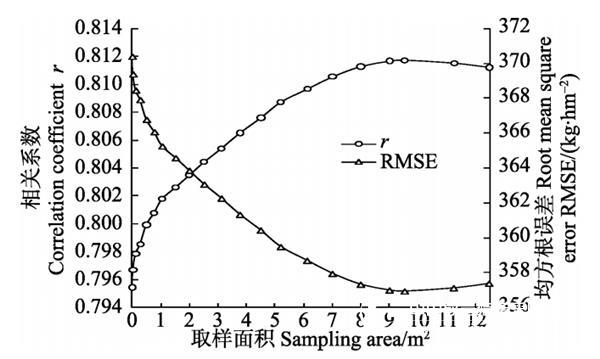
Fig.2 Correlation coefficient and RMSE of PLSR model with yield and four vegetation indices as a function of spatial sampling window area
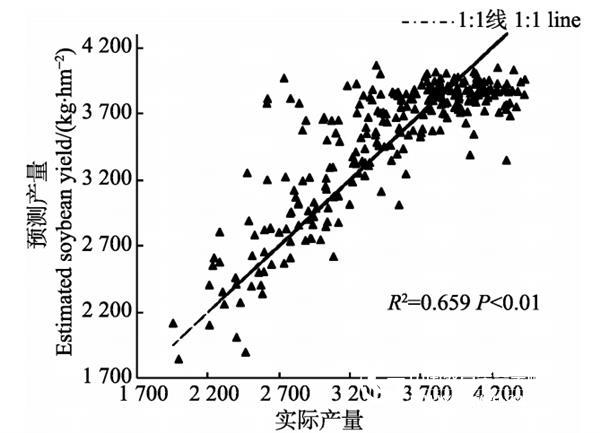
The canopy spectrum extracted by the spatial sampling range of 4.5×2.25m is the final spectrum, and the PLSR model between yield and vegetation index is established. The scatter distribution of actual yield and predicted yield is shown in Fig. 3. The established soybean yield model is:
Production = 68.8 GNDVI + 79.2 NDVI + 26.2 RVI + 293.7 MSAVI 2-227.87
The use of drone remote sensing platform for soybean yield estimation is of great significance for achieving high-throughput rapid access to large-scale soybean yields, which can help breeders quickly screen soybean varieties. In this study, the optimal spatial scales of the canopy spectra of different soybeans obtained from the UHD185 spectral imager are analyzed. The results show that the spectral data calculated based on different spatial scales are different in the near-infrared band, and the strains are between the lines. The vegetation index has different levels of significant differences at different spatial scales. The spectral information at each spatial sampling area is calculated based on the spatial resolution of the original hyperspectral image, and then the spatial scale is optimized. In future research, the spectrum under the optimal spatial sampling area can be resampled and analyzed. The effect of spectrum on the estimated yield of soybean under resolution. At the same time, it is also possible to consider the spatial scale law of hyperspectral imagery of drones based on different crops under different experimental conditions. In addition, the high-spectrum has a high spectral resolution, and can be optimized for the spectral spatial scale by performing in-depth analysis on the spectral information.
Note: Due to the 2016 product upgrade of Cubert manufacturers, UHD185 has been renamed to S185.
WUYI YINGYUAN IMP&EXP CO; LTD. , https://www.yingyuandrinkware.com